
Understanding the Two Digital Divides, Digital Rights, and Data Justice in Los Angeles
The way we discuss digital equity has changed significantly in recent decades. Early advocates focused on adoption and access, but these goals are now understood to be intertwined with broader social harms. While it may be tempting to dismiss these earlier perspectives as naive, doing so can prevent us from fully grasping how to protect democratic intentions in initiatives like those addressing the digital divide, and it can make it difficult to propose actionable critiques to help local communities.
Reexamining early debates around digital rights, can help us contextualize more recent discussions around algorithmic (in)justice (Eubanks 2019; Noble 2018; O’Neil 2016), and equip communities with the necessary knowledge to democratize our digital spaces (Benjamin 2019; Srinivasan and Rushkoff 2019), where these early themes still feature prominent roles – albeit via exclusionary outcomes that counteract early calls for digital equity via adoption and access. This can be particularly impactful if we concretize these discussions relative to the communities or cities where digital inequities are lived.
Thus, whether the outcomes of increased access and adoption impact communities positively or not, and to contextualize our shifting understanding of digital rights, reflecting on these early aspects of the digital divide is essential to our mission of empowering the UCLA community and the public with the framework of Data Justice. On the one hand, because it helps us stay abreast of the potential implications of this adoption, and on the other, because it offers important context regarding an important thematic that, for the better or worse, found itself at the center of discussions about digital rights, to the extent that today digital equity initiatives are still focused primarily on access and adoption. (Delete the Divide n.d.; Digital Equity LA Coalition n.d.)
This webpage highlights key themes in the evolving discussions of digital rights and data justice, drawing attention to the connections and contradictions that have emerged over time. We begin by exploring the digital divide, particularly focusing on the adoption and access to Information and Communication Technologies (ICTs). By reviewing early discussions of adoption and placing them alongside critiques of the online experiences it enabled, we can observe how these early efforts, though well-intentioned, often ended up reinforcing many of the same disparities they sought to resolve. Through these examples, we aim to show how concentrating on a specific locality, like Los Angeles, allows for a clearer understanding of these contradictions and how they impact democratic participation in digital society. This analysis not only informs policy and initiatives but also serves as a warning about more recent trends in technological determinism, which are likely to have similarly unforeseen and potentially harmful outcomes.
LA’s First Digital Divide: Access, Adoption, and its Exclusions
Why start with the Digital Divide?
It is crucial to recognize, investigate, and make public how digital device adoption and internet access are evolving in Los Angeles. However, this focus should not stem from the assumption that maximizing digital adoption and access is inherently beneficial. There are several initiatives and projects aimed at bridging the Digital Divide in LA, most of which do find their raison d’etre in maximizing the adoption of, and physical access to, digital devices and internet service. Whether their focus on access and adoption benefits the communities where they’re implemented, has been questioned and empirically contended in academic literatures for several decades now (Hampton and Wellman 2000; Hiltz and Turoff 1993; Kraut et al. 1998; Light 2009; Nie and Erbring 2001; Sproull and Keisler 1992).
Today, the emphasis on digital adoption, often referred to as the "first digital divide" following Paul Attewell’s conceptualization (Attewell 2001) may even be understood as complicit in a framework of economic incentives that hungers for data at the expense of its users, as proposed by Shoshana Zuboff. (Zuboff 2019) Given these concerns, it is imperative that communities have access to tools that help them stay informed about the patterns and implications of digital adoption, allowing them to critically engage with the forces shaping their digital landscapes.
Attewell’s two Digital Divides
A widely used framework for discussing the evolution of Digital Divide discourse is Paul Attewell’s two-level description of the Digital Divide (Attewell 2001). This framework complicates the early critique of digital inequalities, which previously saw access and adoption as unquestioned improvements. Attewell highlighted that even when access is available, disparities in skills and opportunities persist. He termed access-related inequalities as the "First Digital Divide" and described subsequent disparities in usage, skills, and the benefits gained from digital access as the "Second Digital Divide."
Regarding the First Digital Divide, various studies have shown that limitations to access align with demographic factors linked to structural inequities. Census data from Los Angeles reveals that, while digital device adoption and internet access have improved over time, demographic disparities persist. For instance, a multivariate linear regression of 2022 ACS data shows that lower-income households, often with higher representation of people of color, still experience less digital access compared to wealthier, predominantly white families in LA County.
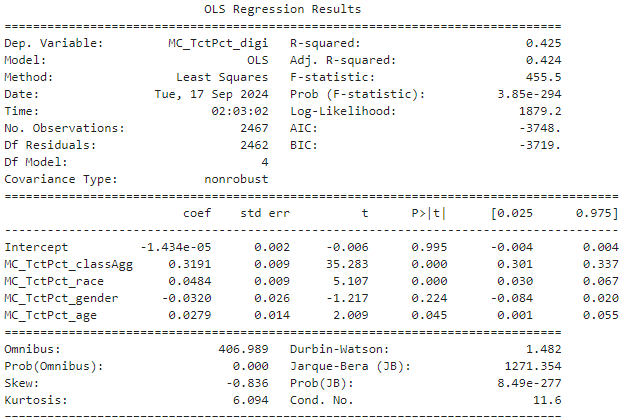
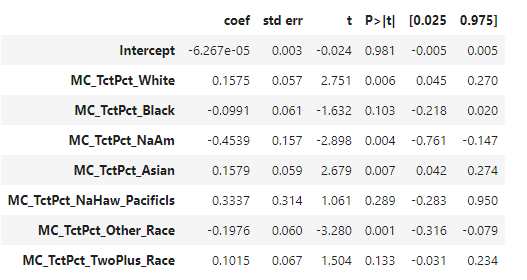
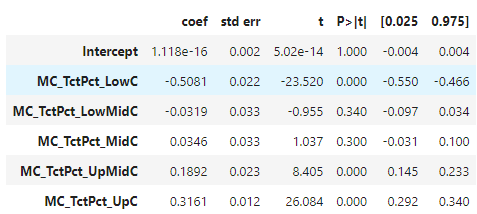
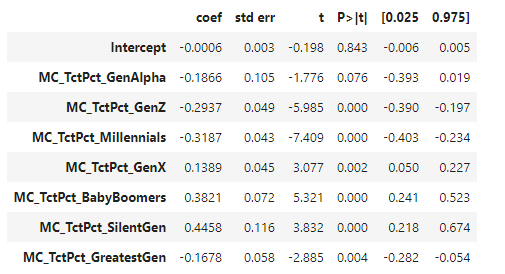
Interestingly, generational data reveals that Gen X and Boomer households tend to have more access than younger generations like Gen Z and Millennials, contradicting earlier findings that younger populations were more likely to adopt digital technologies. This is likely influenced by mediating factors such as income class, with wealthier families, who tend to have fewer children, experiencing greater access overall. Nevertheless, income and class remain significant moderators of access at the county level.
LA Digital Divide Map
Already, scholars have begun to look beyond simple questions of access. By identifying disparities in the use and skills applied once access has been attained, we can see these conversations resonate with insights from Science and Technology Studies (STS) and other fields questioning the co-productive relationship between society and technology (Light 2009).
Theorists like Bijker, a key proponent of SCOT theory (the social construction of technology), have long advocated for a bilateral relationship between technical and socio-cultural factors shaping technology’s development and its role in society(Bijker 2008). Echoing this perspective, scholars have started to challenge the assumption that increased access inherently leads to positive outcomes, asking, “Can we reasonably expect the inequalities that correlate with a lack of access to technology to disappear?” (Light 2009). These inquiries characterize what Attewell termed the second Digital Divide, emerging in the 2000s and building on earlier academic perspectives that primarily viewed the Digital Divide as a problem of access. They reveal that, alongside access, there are significant disparities in usage, skills, and opportunities among those who do have digital access.


The second version of the LA Digital Divide Map (LA Second Digital Divide Map) aims to capture these complexities by analyzing time-series data to explore whether increased access to ICTs benefits all demographics equally.
References
Methods
The first step in creating this tool was to understand and collect the necessary data on digitalization and demographic information for LA County. As noted on our site, the Census Bureau’s American Community Survey (ACS) data serves as an exceedingly granular resource for these investigations. Although the ACS is not strictly part of the census, it is administered by the same Bureau and closely related to census data analyses.
Of course, the census faces controversies, often reproducing inequities through its simplified representations of diverse populations into predetermined numerical and nominal categories—a process known as datafication. For a more in-depth discussion, please visit our Ethics section.
To collect ACS data, I used Python to query the ACS API, starting with requests for variable names and descriptions to navigate the often confusing Census Variable Naming System.
Variable names typically begin with a letter prefix indicating the data type, followed by numbers and suffixes for specific characteristics. For example, B28002_001E represents the total estimate (E) for computer ownership from table B28002. This system ensures consistency across datasets and facilitates efficient data processing.
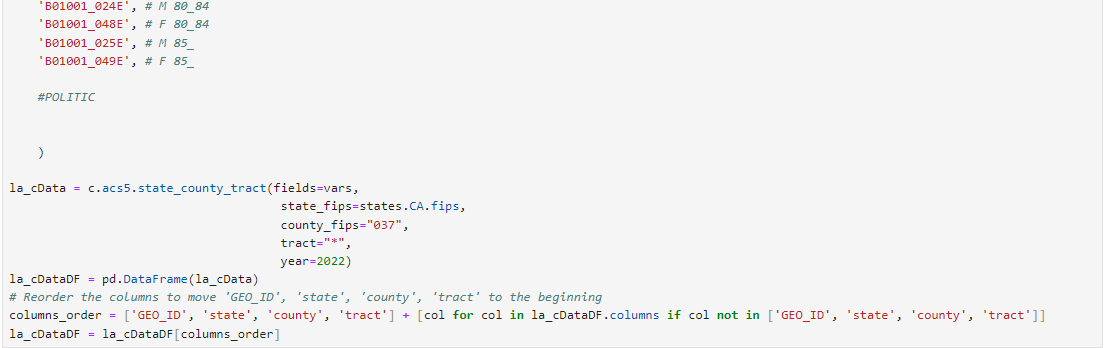
My research focused on demographic features (wealth, race, ethnicity, sex, generation) for a specific geographical region (LA County), resulting in the following API call.

In my case, the data points on age were overly granular, leading me to represent wealth through relative class categories (e.g., Upper Class, Upper-Middle Class) rather than numerical figures. I subsequently cleaned and transformed my data tables. To replicate this process, you can follow these transformations:
This data was intended for geographic representation in a map, illustrating how each demographic or digital access variable is distributed geographically. I further transformed the data to show (1) the percentage distribution of each data category, such as the percentage of households in each economic class within a tract, and (2) the mean-centered percentage, indicating how much each category deviates from the LA County average. For example, if a tract has a 30% rate of home ownership, and the LA County average is 25%, the mean-centered percentage reflects a +5% deviation from the county average. Through these transformations, users can see relative figures that display the distribution of each variable within their selected region, as well as the deviation from the mean, rather than raw household numbers without context.
Finally, I represented these figures in a Tableau dashboard, which was the most time-consuming stage, involving multiple data representations. An overview of this process requires familiarity with Tableau, but the representations included:
To further assist those looking to replicate this tool or apply similar analyses in different contexts, I offer an extensive tutorial that details all the steps taken to create this mapping dashboard in Tableau. This includes writing calculated fields in a SQL-like language, automating executions based on user actions, and creating parameters to streamline these processes.
- Reference 1
- Reference 2
- Reference 3
- Reference 4
Paragraph 1 about LA’s Second Digital Divide...
Paragraph 2 about LA’s Second Digital Divide...
Overview of Digital Access...
Details on Data Methodology...
Discussion on Community Impact...